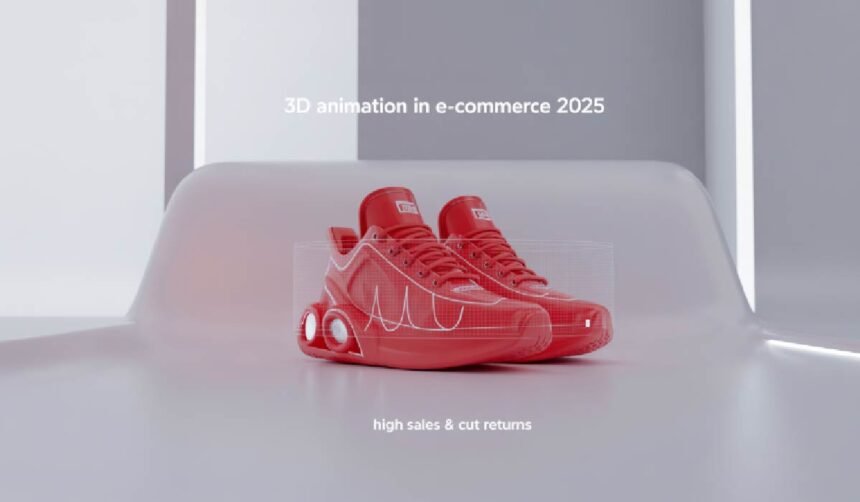
Flat product photos stall sales. Shoppers hesitate when they cannot see the detail, scale, or context. They want proof before they buy. In 2025, 3D product animation services delivered that proof. Brands using 3D and AR see higher conversions and fewer returns. Teams that wait fall behind.
Industry numbers underline the cost of hesitation. The National Retail Federation reports that 16.9 percent of U.S. retail sales were returned in 2024, totaling around 890 billion dollars. Online return rates run even higher. That loss drags margins. 3D solves part of the problem.
Why Shoppers Pause at the Product Page
Online buyers cannot test products before they buy. They guess about fit, finish, or size. That guess creates doubt. Doubt lowers conversion and fuels returns.
3D cuts the guesswork. Buyers rotate, zoom, test color variants, and use AR to preview at home. Confidence rises, and so does purchase intent. Shopify has reported that adding 3D and AR can boost conversion rates by up to 250 percent.
Proof That 3D Boosts Conversions
The numbers speak clearly. CORT, a furniture retailer, saw conversions increase 111 percent after adding 3D and AR features. Other furniture and home brands report consistent double-digit lifts. Even a modest 20 percent bump on a high-traffic product page means real revenue growth.
For most e-commerce categories, 3D produces steady 15 to 30 percent gains. For products with higher fit uncertainty, the lift can be even larger.
The Return Problem and How 3D Fixes It
Returns cut into margins. AR and 3D address this directly. Research shows shoppers who use AR are 66 percent less likely to return products. Vogue Business reports a 25 percent drop in returns on items with digital try-on or fitting tools.
Apply the math to your own store. If monthly sales are 1,000,000 dollars with a 16.9 percent return rate, you lose 169,000 dollars each month. Cutting returns by even 25 percent on SKUs that support 3D saves over 42,000 dollars in a single month. That alone covers the cost of many pilot programs.
How 3D Supports the Entire Sales Funnel
3D helps across the journey, from awareness to checkout.
- Discovery. Interactive ads like Google’s Swirl let shoppers spin products within the ad itself. Engagement and intent rise.
- Product page. A clean 3D viewer lets customers toggle variants, zoom, and explore details. Shopify and other platforms already support it.
- Retention and email. Lightweight 360 spins inside emails remind buyers why they liked the product in the first place.
What the 3D Workflow Looks Like
You do not need advanced technical skills to understand the workflow. Here are the steps:
- Collect CAD files or high-resolution photos.
- Build a 3D model with correct geometry and scale.
- Add textures and finishes with PBR materials.
- Export in glTF or GLB for the web, USDZ for Apple AR.
- Place the viewer on your PDP and link product variants.
- Test load time, mobile usability, and visual accuracy.
This process is repeatable once set up. A single asset can be reused for web, ads, and AR.
What You Get When You Hire a 3D Partner
Hiring a vendor is often the first step. Good partners handle modeling, materials, motion, and integration. This is what people mean by 3D animation services for e-commerce. They supply one-stop modeling, animation, and export for your storefront.
The same applies when people say 3D product animation services. The label changes, but the service is the same. It covers 3D models, short motion loops for ads, and web-ready viewers.
Smart Questions to Ask Before Signing
Here’s a checklist you can use when vetting a provider:
- Do they deliver in GLTF/GLB and USDZ formats?
- Can they optimize for mobile speed?
- Do they handle product variants within CMS or PIM?
- Will they provide analytics events tied to GA4?
- Do they support A/B testing for conversion and returns?
- Who owns the final model assets?
- Can you reuse the assets in ads, PDPs, and AR?
A reliable vendor answers yes to all.
ROI: How to Model the Impact
Use a baseline model. Example: 100,000 sessions per month, 2 percent conversion, 70 dollars AOV. That equals 140,000 dollars in sales. If 3D lifts conversion 30 percent, the new rate is 2.6 percent, or 182,000 dollars in sales. That’s a 42,000 dollar lift. If the pilot cost 15,000 dollars, you earn it back within weeks.
Returns add even more impact. A 25 percent cut in returns on supported SKUs generates savings on top of new revenue.
How to Launch a 30-Day Pilot
Week 1. Select one flagship product and two variants. Define viewer placement and AR button.
Week 2. Vendor builds and textures the models. Export to GLB and USDZ. Review on real devices.
Week 3. Install the viewer on a dev PDP. Wire in analytics. Prepare one 3D ad unit.
Week 4. Launch. Monitor load time, viewer interactions, conversion, and returns. Report results.
Performance and Accessibility Notes
- Keep files under a few megabytes.
- Always provide a fallback gallery for older devices.
- Test across mid-tier Android and iOS phones.
- Add alt text and keyboard navigation for accessibility.
- Track key events like rotation, AR taps, add-to-cart, and return outcomes.
Where 3D Works Best by Category
- Furniture: AR helps buyers place items at home.
- Beauty and apparel: Try-on tools cut returns and boost confidence.
- Consumer electronics: 3D clarifies ports, stands, and accessories.
- Sporting goods: Buyers test fit with existing gear before buying.
Measuring Success With Clean Experiments
Set a holdout group. Match traffic sources. Run tests for a full cycle. Define your success rules before you launch. For example: rollout if conversion lifts 10 percent and returns fall 5 percent without page speed impact.
Final Takeaway
3D is no longer an experiment in e-commerce. It is a sales tool. It boosts confidence, reduces returns, and drives higher margins. The cost of waiting is high. Start small, prove the lift, and scale. By 2025, the best product pages are interactive, inspectable, and shoppable. That is what keeps buyers from hesitating and competitors from catching up.


